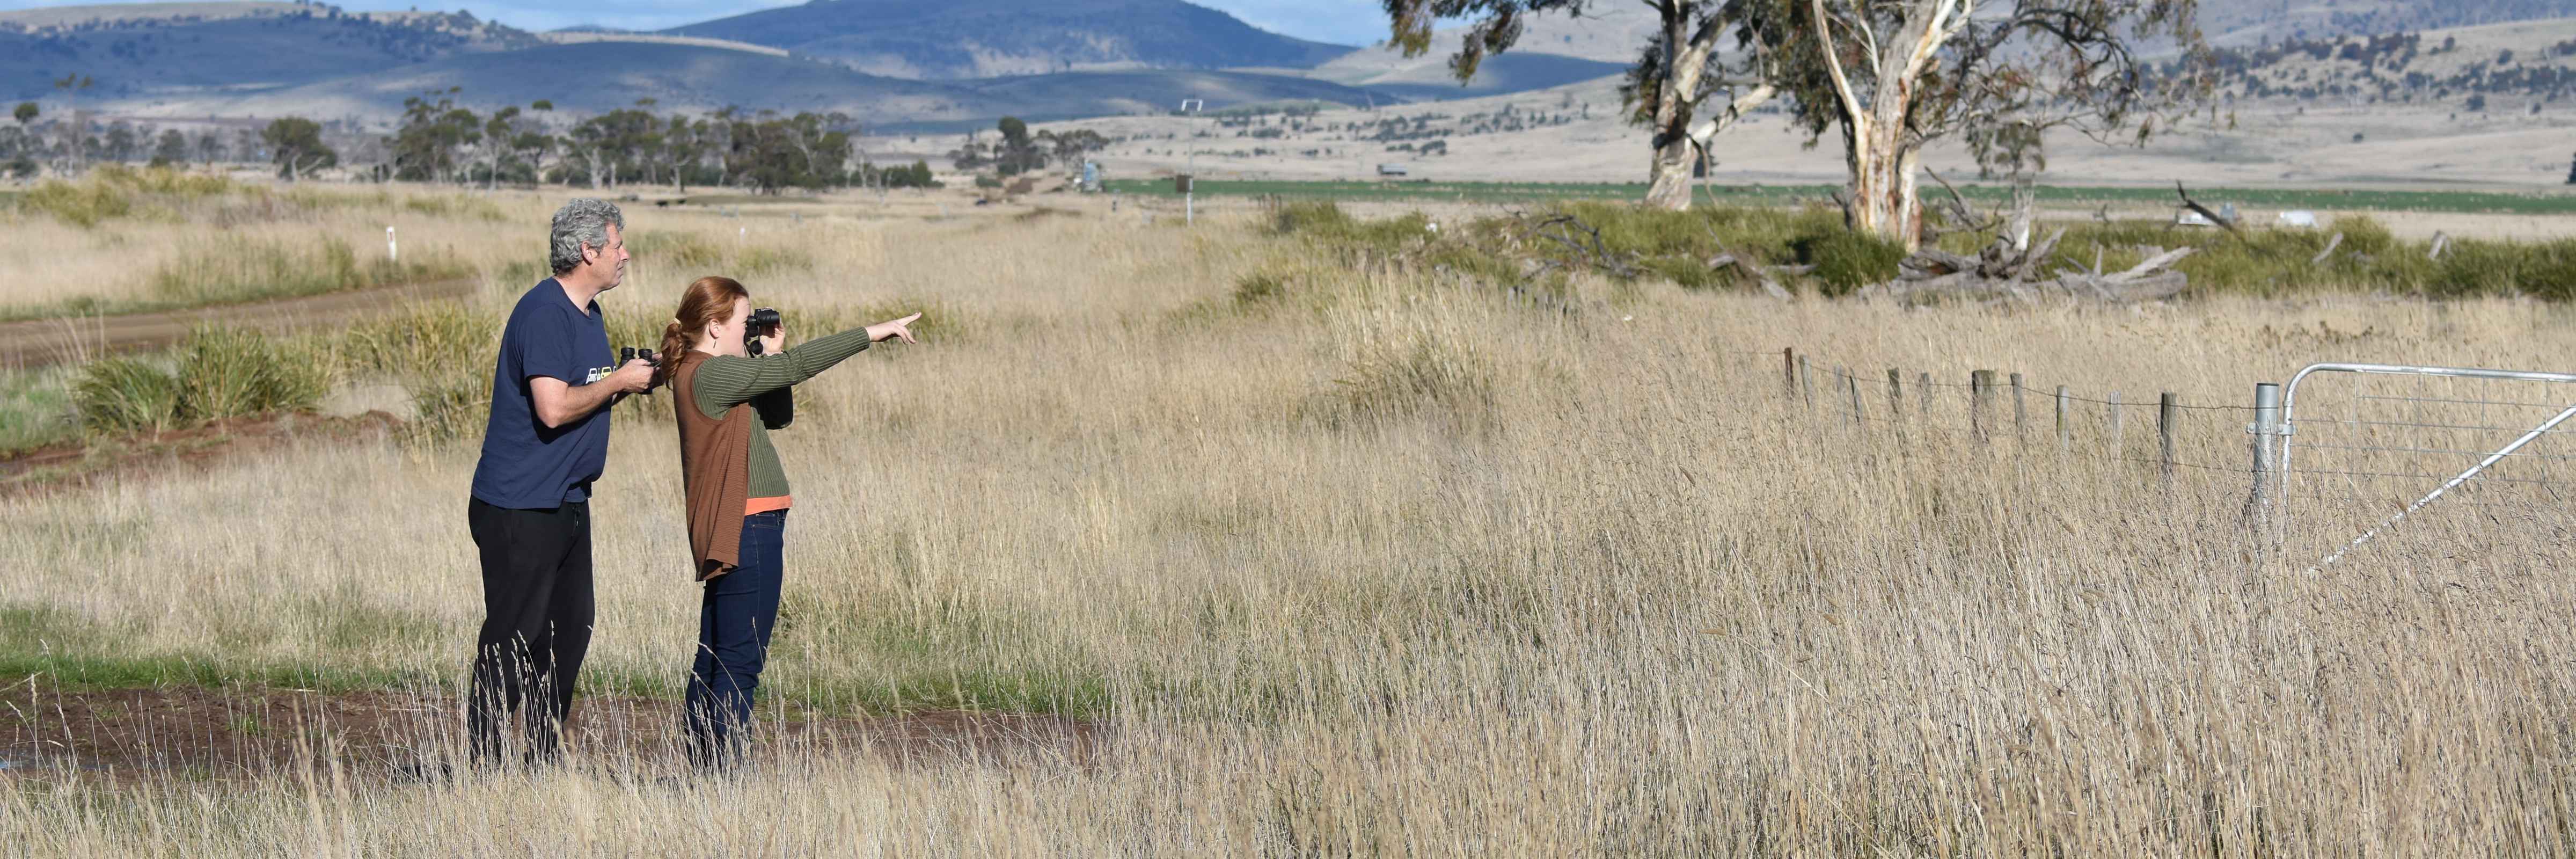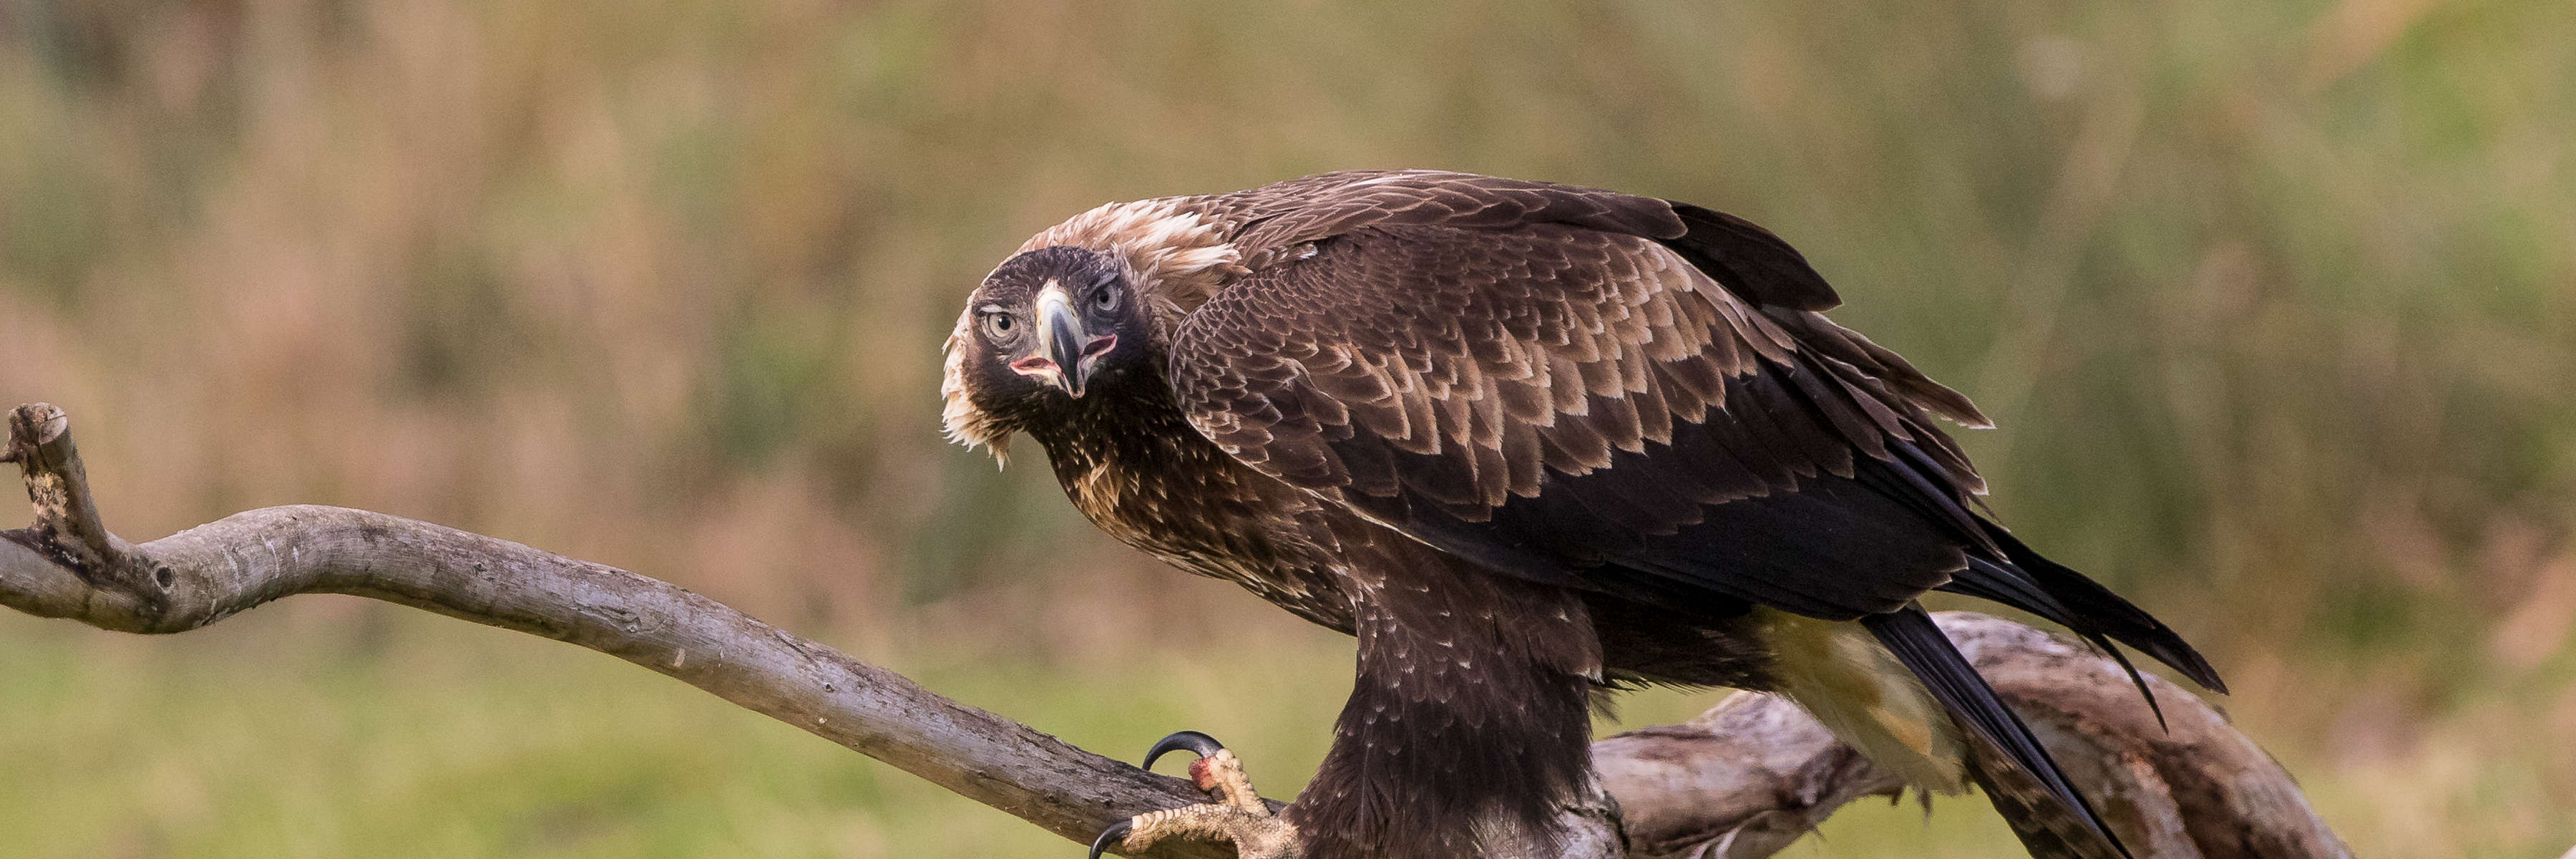
We want to know: how’s the Tasmanian wedge-tailed eagle faring?
A shocking range of things people do can lead to the death of the iconic Tasmanian wedge-tailed eagle, or constrain its breeding, like: building wind turbines and electrical infrastructure; driving cars; removing disturbance-free nesting habitat; putting out rat poison; photographing birds on the nest; shooting. After the eagle’s legal listing as Endangered in the late 90s, numerous organisations and individuals made substantial efforts to reduce their impacts. Unfortunately, there’s not much information on the extent to which each activity affects the overall population, and whether these efforts have been effective.
It’s possible that efforts to protect the eagle from extinction aren’t addressing the problems adequately. The ultimate indicator is the population trend — increasing, stable or decreasing? Yet prior to the establishment of NatureTrackers, this much-loved species wasn’t formally monitored. In May 2018, Where? Where? Wedgie! (WWW) surveyors started to change this.
“Patience, persistence and perspiration make an unbeatable combination for success.” (Napoleon Hill)
It would have been so helpful and motivating to know straight away, after that first, pilot year’s effort, whether or not the eagle was recovering. However, this stuff takes a long time! In light of the initial findings, we had to adjust the method slightly. Next, we needed to survey for multiple years. The principle is: ‘if we all follow a consistent method across Tasmania year after year, any major or continuing changes we detect should be true indications of changes in population numbers’.
Each year, for each species, all our hard survey work boils down to a single dot on a graph — an index of abundance — which only starts to make sense once we have values for other years with which to compare it (see the Science page, under ‘What is done with the survey data?’ to learn how this indicator is calculated). On top of that, the numbers of any wild population are likely to bounce around by a certain amount from year to year, so we have to assess the significance of any changes over a multi-year time-scale.
OK, but how are things looking so far?
Between 2019 and 2022, the analyses have found no significant change in population size of the Tasmanian wedge-tailed eagle from year to year. It’s certainly reassuring to see no sign of anything catastrophic over this short period. However, several more years of data are still needed before a trend becomes clear.

The graph shows the index of abundance calculated from the WWW surveys for 2019 to 2022. Note that we don’t yet know how this index translates to the actual population size — it just means we can see how that size is changing over the years (more on figuring out population size below, under ‘Finessing WWW’).
The vertical lines running through each dot represent 95% confidence intervals. If there’s no overlap between two years’ lines, then we know that the population size has changed significantly; and the more surveys we do each year, the shorter these lines. For more on what’s done with the data, and what the ‘index’ is, see the Science page under ‘What is done with the survey data’ and, ‘Current data analysis method’. You can also go deeper in the Data4Good article.
It’s now time to formally publish the results so far in a peer-reviewed science journal, to invite wider, expert scrutiny and reassurance that we’re on the right track. Keep an eye out for emails and news updates on this.
Limitations…
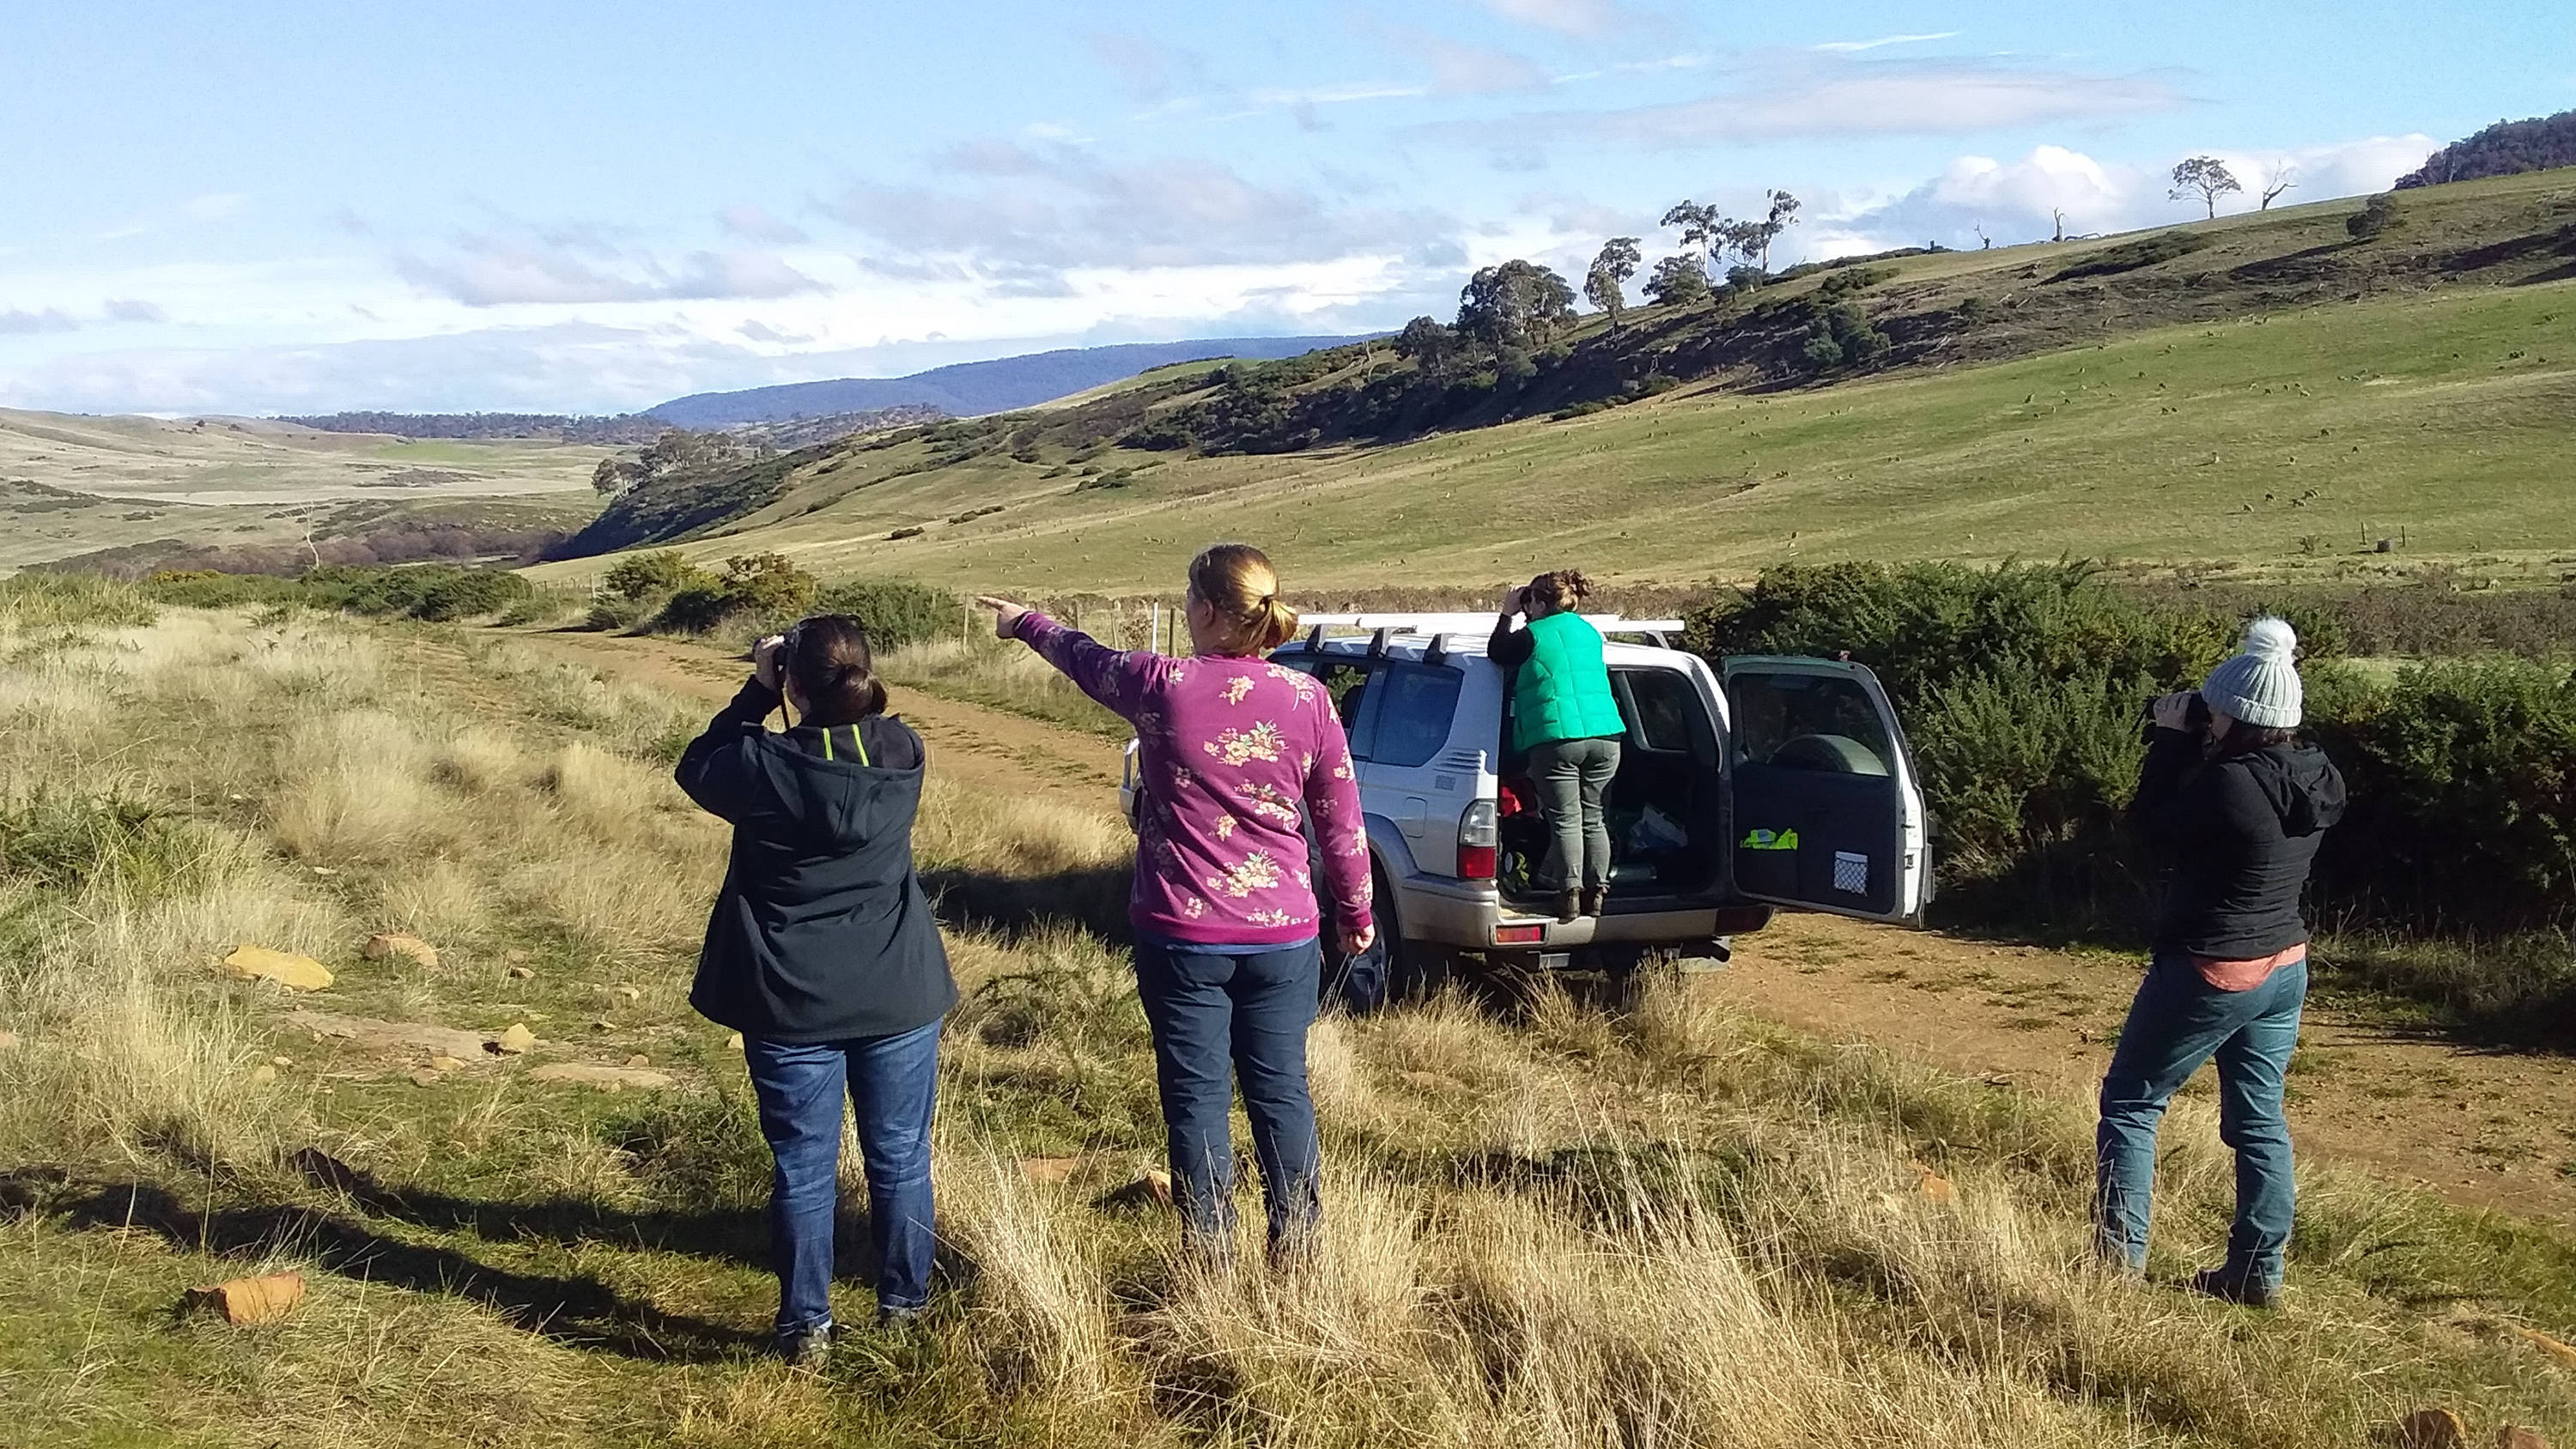
We’re looking for the overall population trend, but it would also be valuable to pick up any dramatic changes in population size more quickly. Jo the Statistician (aka Dr Joanne Potts of The Analytical Edge) calculated that if we could survey for two days in each of 100 squares every year, reasonably evenly across Tasmania to cover all typical environmental conditions, then we could detect any changes greater than 30% between years.
-
Distribution of squares surveyed in 2019 across Tasmania 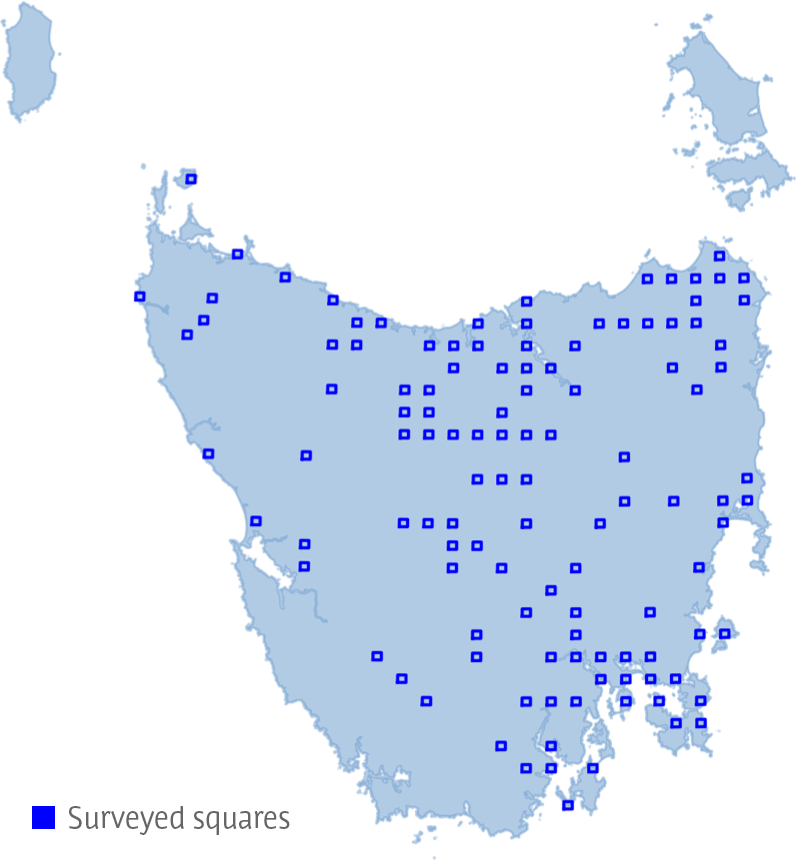
-
Distribution of squares surveyed in 2020 across Tasmania 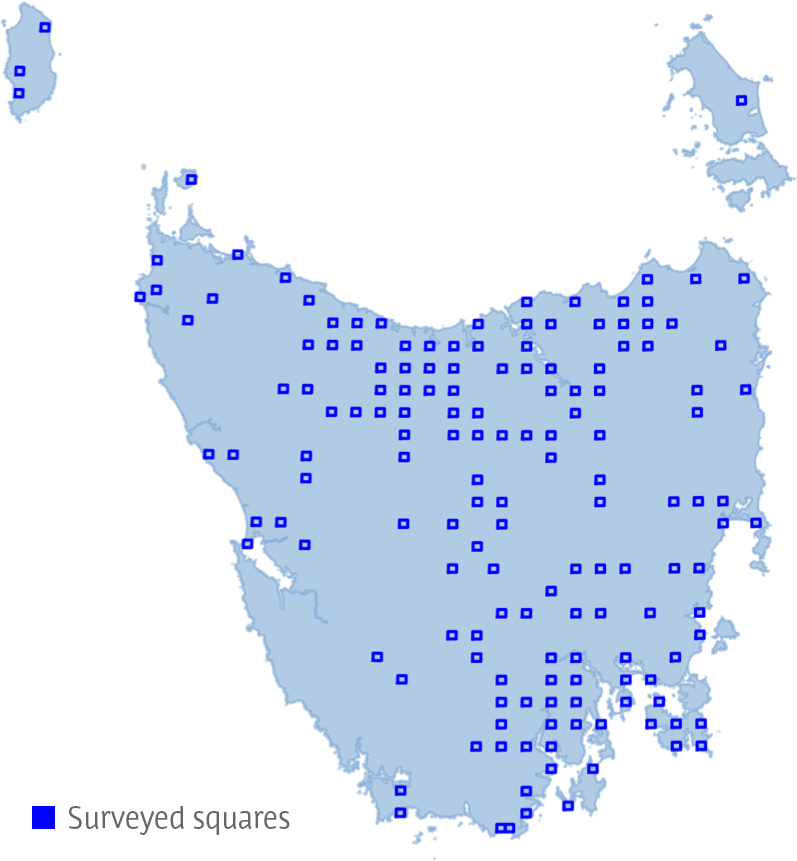
-
Distribution of squares surveyed in 2021 across Tasmania 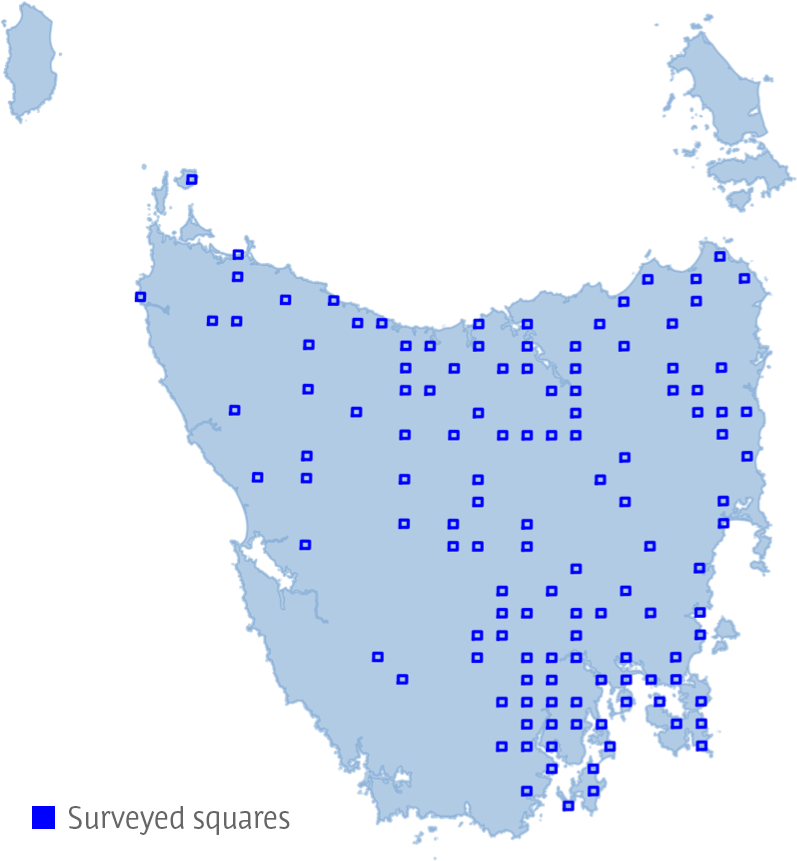
-
Distribution of squares surveyed in 2022 across Tasmania 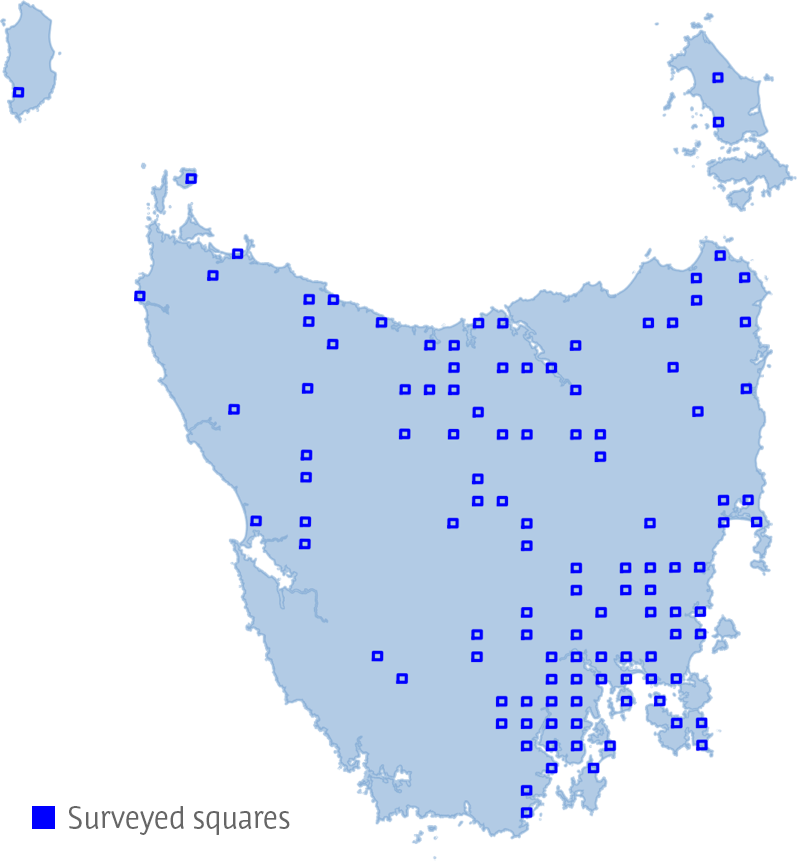
Disappointingly, we haven’t yet, quite, managed two days of surveys in 100 squares in a year, although we’ve always managed at least 80 squares. Also, as you can see from the maps (each blue dot is a surveyed square), the coverage of Tasmania isn’t as even as we might ideally like for this goal.
We’re nonetheless accumulating an impressively solid, useful dataset, where previously there was no information at all. So we would still detect any really large, short-term changes in population size, and we will also, eventually, get a clear indication of the population trend over the longer term.
Finessing WWW
We’d all like to have a better idea of the actual population size. Just how close are the eagles to zero? If the index of abundance starts to dip, how much do we need to worry?
A recent, successful Australian Research Council grant application, led by Drs Christopher Johnson and James Pay of the University of Tasmania, is likely to prove extremely helpful here. As James tracks the behaviour and life stories of his GPS-tagged eagles, it will become clearer how we can most effectively reduce the threats, and how these threats may affect the population size in future. He can also get an idea of adult population size from the typical size of the tagged adults’ exclusive territories across Tasmania.
Additionally a PhD student, due to start at the end of 2023, will build on WWW’s current approach, exploring analyses that may detect population changes more quickly, and estimate population size from each year’s survey data. Information from the tagged eagles, supported by extra WWW surveys in their territories, will be invaluable. We need to know how many nearby eagles we don’t spot in our surveys; we can estimate this from the proportion of surveys that turn out to miss a tagged eagle known to have been in the surveyed area. With careful analysis, this information can be used to estimate the total population size from the number of eagles that WWW surveys record. So, expect a callout in future years, to help with those extra WWW surveys for tagged eagles!
In the meantime, there are plenty of other opportunities to add to the value of WWW. The more numerous, evenly-spread surveys that we can manage, the more accurate information on wedge-tailed eagles we will generate, and the more quickly we can detect any population changes. This would also help us obtain similar quality data on some of the other species that we survey for, such as white-bellied sea-eagles. Additionally, there’s the exciting potential to obtain not only statewide population trends, but, with enough annual surveys, more localised information too.
So if you were wavering as to whether you might do WWW this year — go for it! If you might be able to persuade others to contribute too — doubly fantastic! Just a few extra surveys this year could make 2023 the first year of 100 squares.